Lean managers have much trouble understanding the traditional cost accounting reports to run their operations. They just want a simple and easy to understand statement they can use. Lean Accounting was developed just for that need.
Instead of giving lengthy description, I am attaching a link to my slideshow. After viewing this you should have a general understanding of this concept. You should seek professional help to implement this. You can find hundreds of consultants on the web.Introduction to Lean Accounting
Sunday, May 20, 2012
Thursday, April 26, 2012
The Role of a Plant Accountant
Plant accountants (PA) work as in-house cost accountants to manufacturing plants. Their job responsibilities do differ significantly from general accountants. Based on my experience as a PA or Cost Accountant (CA) , this person is basically a Business Partner (BP) between Finance and Accounting (FA) and plant personnel.
By being a BP you will work with a wide range of different functions. You must be very familiar with the in and outs of each function. Also must fully understand all the business processes going on throughout the plant. I have worked with personnel from Plant floor all the way to the executive level.
My experience includes being very active in the budgeting process, continuous cost improvement projects, capital budgeting, forecasting, heavy ad-hoc reporting requests, and many other projects. Also includes doing the routine Accounting functions needed to be completed. One more note, you must be very tech savy ie Advanced Excel, Access, and be able to work with IT on many projects and requests. You will almost be like a part of IT function.
In most cases this position is a staff level position who has a direct report to the Controller or CFO. Also will have indirect reports to Executive, Sales, Production, Manufacturing, Marketing, and Human Resources. You can see that this position is very critical to the plant. This position along with engineering can actually pay for themselves based on cost saving initiatives.
Thursday, April 19, 2012
Using Excel What If Add In Data Table Function
As a Microsoft Office Specialist (MOS), and an excel expert, also experienced in designing thousands of cost model, I have been called in many of times to evaluate other spreadsheets to determine if any improvements or efficiencies be made for improvements.
One area that I have crossed many of times is the use of creating a table with either a one or two variables to calculate. I have seen cases where the user has created hided fields to bounce the calculation. Also in some cases, I have seen that the user has manually calculated the amount and has entered the values in. (NOT RECOMMENDED)the excel user who is familiar with creating complex formulas populate the table out.
The below attachment is an example of creating this table using complex formulas. It took me an excel expert over 5 minutes to complete. I had to make sure that I used the absolute cell reference to get the correct results. Can you image how long it would take an average user to complete. Also just think if your your entire workbook was riddled with these formulas. Formulas actually take up more space and slow down the processing speed.

Now I am going to introduce you to a much better way to do this. First you must install the "What If" add-in. Most users nearly 95% are not aware of this feature. Only will learn it in an advanced excel class or book.
I will give you a brief 101 class about this topic.
-A data table organizes the results of several what-if
analyses within a single table.
-A two-variable data table uses two input cells, but unlike a one
variable data table, only the value of single result cell can be displayed
.
Without explaining this in detail I am attaching a slide below.

Again not getting into too much technical detail but the above is a finished version of two piece variable table. Each cell is populated when you use the What-If data table function.
The topic is really advanced and the user needs to rearch the topic before attempting to attempt this. A good resource is Wayne Winston books about using Excel to solve business problems.
If anyone wants to learn more about this topic I would be happy to share, Please reply in comment section.
Wednesday, April 11, 2012
Cost Volume Profit Completed Reports
This is continuation of my previous blog related CVP. I am enclosing several screen shots of this report.
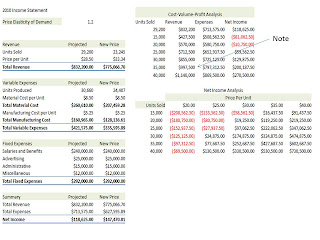 1. The Cost-Volume- Profit Analysis data table show the result of several what-if analyses simultaneously. For example, if annual sales increase to 35K units, the company's revenue will be more than $997K, but the total expenses will be more than $797K , making a net income of $ 200K.
 2. This chart plots the points of the above data table, connecting them with a line. The blue line represents revenue; the red line represents expenses. The break even point occurs at a sales volume of about 20K units. The data table and CVP chart give a comprehensive picture of the impact of sales volume on total expenses and revenue.
 3. This chart shows a different trend line for each of the five possible scenarios.

4. The scenario summary report displays the values of the input cells and results cells under each scenario.
 5. Another way to display the results of scenarios is with a PivotTable and PivotChart report.

6. This is same as in slide 1 above. Determining a value for price elasticity of demand involves a shrewd examination of the market, the product itself, and desires of consumers.
This by far is the most important part of this feature. It allows to calculate the new demand curve. In this sample a 20% was factored in.
This came from a project that I completed taking an advanced Excel course at a local college. I completed several of these projects and also completed a scenario on exam.
I would by happy to share other projects. However, this topic is very advanced and you be ready to devote some time in this. Once you learned this you will be well on the way to help your organization!
 1. The Cost-Volume- Profit Analysis data table show the result of several what-if analyses simultaneously. For example, if annual sales increase to 35K units, the company's revenue will be more than $997K, but the total expenses will be more than $797K , making a net income of $ 200K.


4. The scenario summary report displays the values of the input cells and results cells under each scenario.


6. This is same as in slide 1 above. Determining a value for price elasticity of demand involves a shrewd examination of the market, the product itself, and desires of consumers.
This by far is the most important part of this feature. It allows to calculate the new demand curve. In this sample a 20% was factored in.
This came from a project that I completed taking an advanced Excel course at a local college. I completed several of these projects and also completed a scenario on exam.
I would by happy to share other projects. However, this topic is very advanced and you be ready to devote some time in this. Once you learned this you will be well on the way to help your organization!
Tuesday, April 10, 2012
Analyzing the Cost-Volume-Profit Relationship using Excel
Please note that this is not a tutorial on using Excel but only a recommendation on using this feature.
I have worked in many companies who are unsure what a
reasonable price for the product is. Some companies just set these rates
without doing any research at all. One company who did absolutely no cost study
on this. As a result after a short period of time they ended closing up shop
because they were losing $20 per item and didn't realize it because they didn't
perform What If analyses.
This company should have before they started making the
product should have used one of the most powerful tools in Excel. They should
have followed the below steps.
1. Comparing Types of Expenses-using the Cost-volume-Profit
(CVP) to express the relationship between company's expenses, its volume of business, and
resulting profit or net income.
CVP analysis is an important business decision-making tool
because it predicts the effect of cutting overhead or raising prices on net
income.
2. Another feature is to determine what the break-even point
of the product.
3. After completing step 1 and 2, you can start performing
What-If-Analysis and goal seek of the product.
An example would be what effect on net income if the sales
declined 25k units.
Goal seek takes the opposite approach by specifying a value
for the calculated item and then returning the input value needed to reach that
goal.
The below completed example is from a recent project to determine the CVP using various production and price schedules.

So I highly recommend that you go to the library or bookstore and get you a copy of advanced excel techniques. After learning this you will be WAY ahead of the average excel user.
Subscribe to:
Posts (Atom)